First, here is a quick recap of the story over the past few months:
Fund manager equity allocations reached an extreme in July. At +61% overweight, it was the second highest since the survey began in 2001. This was a clearly identified risk to near term equity performance (post).
In early August, the Euro 350 dropped 8% and SPX dropped 5%. In response, equity allocations fell to +44% overweight.
Moreover, fund managers moved to cash, with cash levels shooting up to 5.1%, also an extreme. As we specifically noted a month ago (post), this was a strong positive: cash above 5% has been close to equity lows in 2002, 2003, 2011 and 2012 (green shading).

The quick fall in cash levels is not a positive. Whatever fear that was generated in August has quickly dissipated. The number of instances is low but in the past, similar falls in cash from over 5% have preceded at least short term weakness in global equities (red shading).

Global equity exposure is back up to 0.7 standard deviation above the long term mean. As we have continually noted, what has been remarkable is how long managers have been highly overweight equities (virtually since the start of 2013). This is longer than any period during the 2003-07 bull market (yellow shading). In the past, after overexposure like that seen in the past 20 months, a washout low would be marked by an equity weighting under +20% (green shading). By that measure, equities are highly over owned.
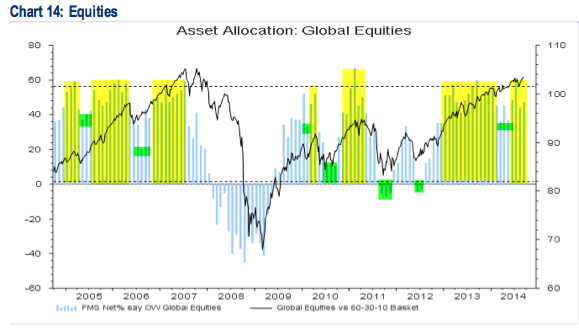
The current bull market is nothing if not persistent. Equities have not been less than +36% overweight since early 2013. So even by recent standards, the August dip to +44% overweight was remarkably shallow.
The biggest surprise in September is that fund managers dropped their US equity exposure to just +1% overweight. Given how strongly the US has outperformed the rest of the world in the past several years, the current exposure is surprisingly low. On a relative basis, the US appears to be under owned. Current exposure is similar to the lows in SPX in mid-2012 and mid-2013.

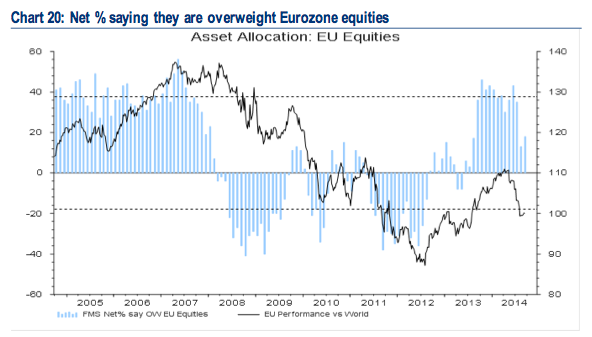
Europe had been the consensus long for 11 months in a row. Exposure in June was +43% overweight, the second highest weighting since June 2007. Since then, the region has strongly underperformed. Allocations dropped in August to +13%. Since then, the ECB announced a rate cut and upwards of $1 trillion in stimulus. As a result, allocations rebounded in September to +18% overweight.
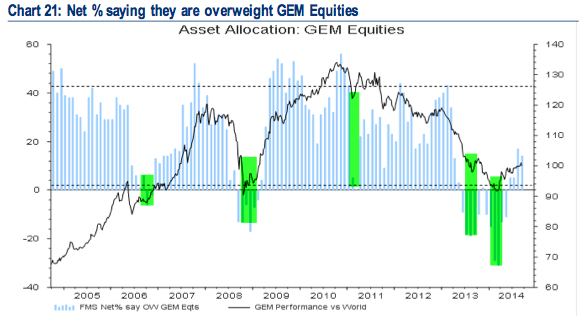
Managers were -31% underweight EEM in March. This was a strong contrarian buy. In the ensuing months, the region strongly outperformed. In August, allocations increased to +17% overweight, the highest in 17 months. As we noted a month ago, EEM is still under owned but the fat pitch has passed. That is still the case, with current exposure slightly lower in September, at +14% overweight.
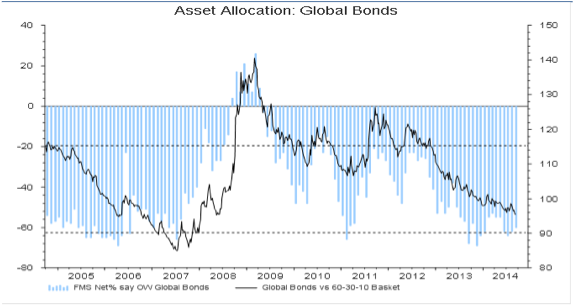
Remarkably, although US bonds have outperformed SPX so far in 2014, fund managers are still hugely underweight. In July, weightings fell to their lowest in more than 6 months. It's only marginally higher in September. Bonds continue to be the most hated asset class and this, in large part, explains why cash balances have not been lower that 4.4% in the past year.
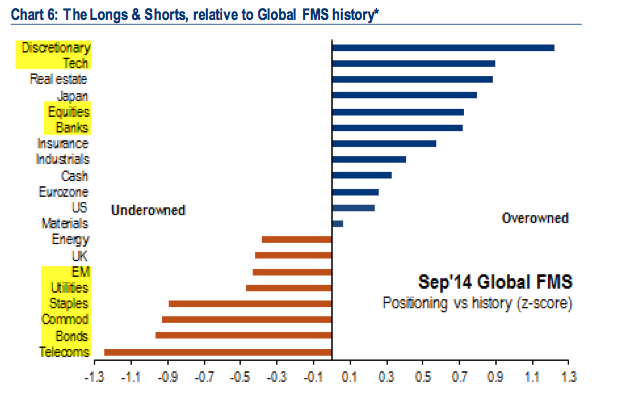
That is equally true in the US. Tech is the most favored sector, followed by pharma, industrials and banks. Utilities, staples and telecoms remain very underweighted.

That is a change from last month, when tech was much less favored in the wake of the sell off. Since the August 7 low, tech has underperformed and both utilities and staples, two of the least liked sectors, have outperformed. Pharma, however, has been the clear leader.

You can see from the data that it should mostly be looked at from a contrarian perspective. Fund managers were overweight EEM more than any other market at the start of 2013, and it was the worst performer in the following year. In comparison, they were 20% underweight Japan in December 2012 and it was the best equity market in 2013. Now, the underweights are the US, defensive sectors and bonds.
Survey details are below.
- Cash (+4.6%): Cash balances sank to 4.6% from 5.1% in August. It's now back in the 4.4% to 4.8% range it has been in since July 2013. Typical range is 3.5-5%. BAML has a 4.5% contrarian buy level but we consider over 5% to be a better signal. More on this indicator here.
- Equities (+47%): A net +47% are overweight global equities, up from +44% in August. In July it was +61%, the second highest since the survey began in 2001 (the highest was 67% in February 2011). A washout low would be under +15%. More on this indicator here.
- Bonds (-60%): A net -60% are now underweight bonds, a small increase from -62% in August. It was -64% in July, the lowest weighting in more than 6 months. For comparison, they were -38% underweight in May 2013 before the large fall in bond prices.
- Regions:
- Europe (+18%): The ECB's decision to cut rates and add stimulus led to an increase in exposure to Europe, from +13% overweight in August. Before August, Europe had been investors' most most preferred region for 11 months in a row. The +46% overweight in October 2013 was the region's highest weighting since June 2007.
- Japan (+23%): Managers are +23% overweight Japan, a sharp decline from +30% in August. Funds were -20% underweight in December 2012 when the Japanese rally began.
- US (+1%): Managers dropped their US weighting again, to +1% overweight from +6% in August and +10% in July. The current weighting is a 19 month low. They had been +30% overweight in August 2013 (the third highest US weighting ever).
- EEM (+14%): Managers decreased their EEM exposure to +14% overweight, from +17% in August, which was the highest weighting in 17 months. It had been -31% underweight in March 2013 when the rally began; that was a new low since the survey started in 2001.
- Commodities (-14%): Managers decreased their commodity exposure to -14% underweight. With the exception of August, it has been less than -15% since early 2013. The decline in commodity exposure goes in hand with reduced sentiment in EEM.
- Macro: 54% expect a stronger global economy over the next 12 months, an decrease from 69% in July. January was 75%, the highest reading in 3 years. This compares to just 40% in December 2012, on the eve of the current rally.
If you find this post to be valuable, consider visiting a few of our sponsors who have offers that might be relevant to you.